How to use Conversational Dashboards
Open Wisdom
Open Wisdom from the left sidebar. This is where you’ll ask questions and generate the charts you want to pin to a dashboard.
Generate a chart or visualization
Type your analytical question in the Wisdom input — for example, “Show me Revenue by Channel for the last 30 days.” Wisdom returns a chart or table grounded in your dataset. This is the insight you’ll pin.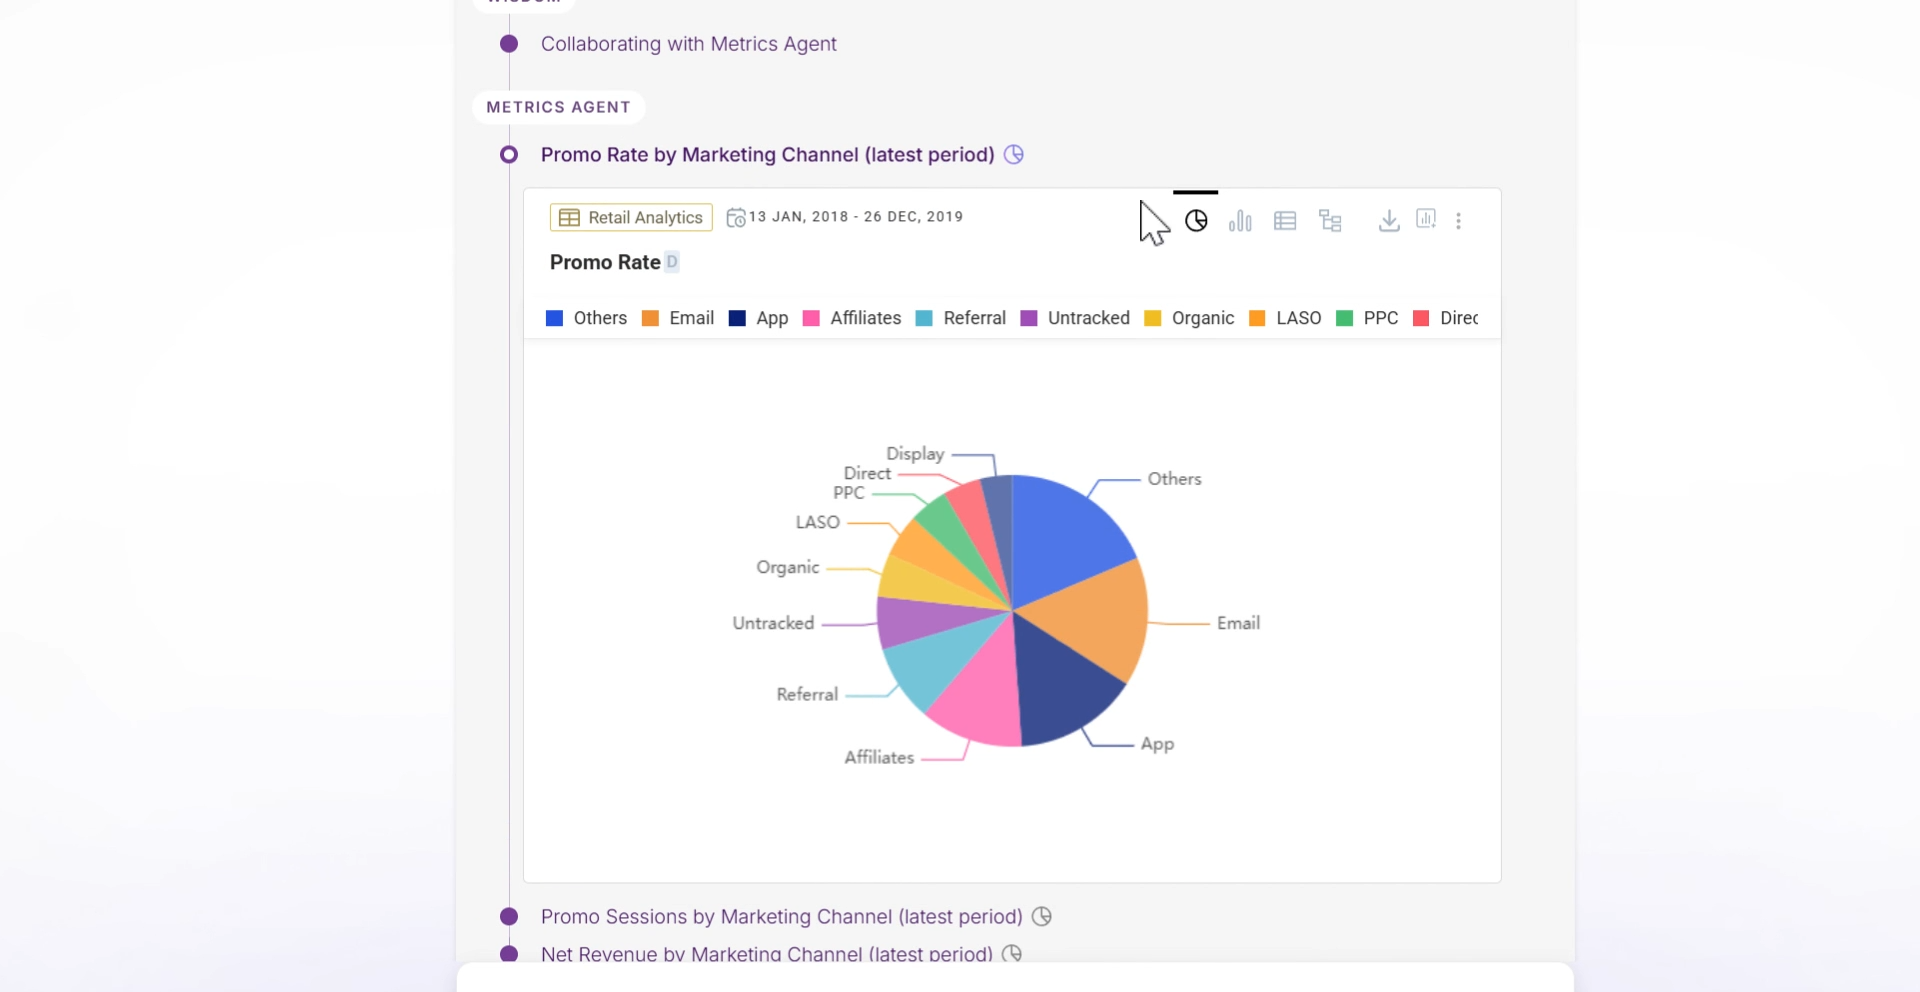
Pin the chart to a dashboard
Hover over the chart — an Add to Dashboard icon appears in the top-right corner. Click it to start the pinning flow.
Choose or create a dashboard
A prompt appears asking where to save the chart. Select an existing dashboard from the list, or create a new one. Give new dashboards a clear name so they’re easy to find — for example, “Revenue Overview” or “Weekly Ops Briefing.”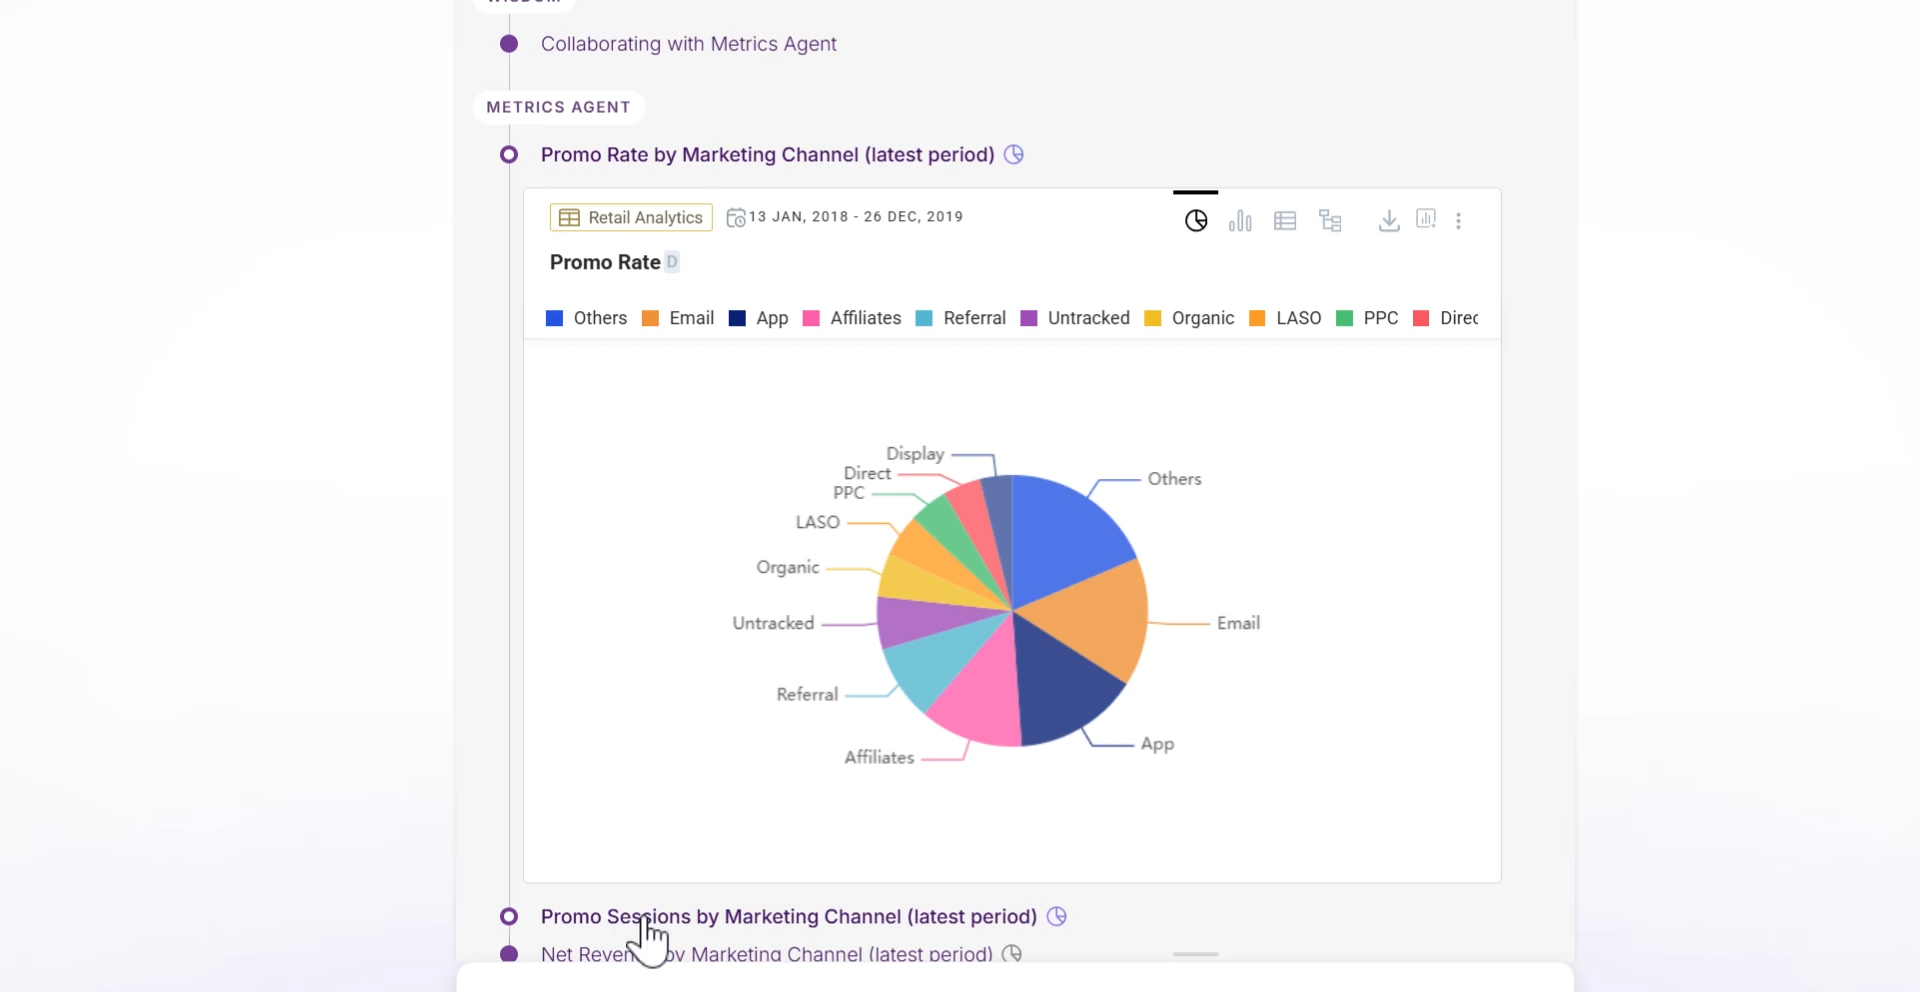
Click Go to Dashboard
After pinning, a confirmation appears with a Go to Dashboard link. Click it to navigate directly to the dashboard and see your newly pinned chart in context.
Review your dashboard
Your dashboard shows all pinned charts in one place. Continue pinning charts from any Wisdom session — each one you add appears here automatically, building up your view conversationally.
QuickLook vs Dashboard
Dashboard
A saved, shareable collection of charts and panels. Accessible from the Dashboards section and editable by team members with the right access.
QuickLook
A dashboard promoted to the Home Screen for fast daily reference. Only dashboards marked as QuickLooks appear on the Home Screen feed.
What’s next
Wisdom Overview
Back to the full Wisdom feature overview.
Dashboards
Build and manage full dashboards outside of the Wisdom interface.
QuickLooks
See how QuickLooks appear on the Home Screen.