How to use Cognitive Skills
Close the Wisdom dialog
If the Ask Wisdom, know everything! dialog is open, close it to return to the main interface. You need the main view to navigate to the Knowledge Corner where Cognitive Skills live.
Go to Knowledge Corner and select Cognitive Skills
Navigate to the Knowledge Corner from the sidebar, then click Cognitive Skills in the left panel. This filters the view to show only Cognitive Skills posts — the pre-built analytical patterns available for your dataset.
Open a recent Cognitive Skills report
Find a recent post — for example, one marked “5h ago” — and click it to open the full report. Each post is a Cognitive Skill result generated for your dataset on the configured schedule.
Review the Engagement Report
The report opens with detailed metrics, structured lists, and a comprehensive overview of recent activity. This is the Skill’s output — a fully rendered analytical report grounded in your dataset’s deterministic pipeline.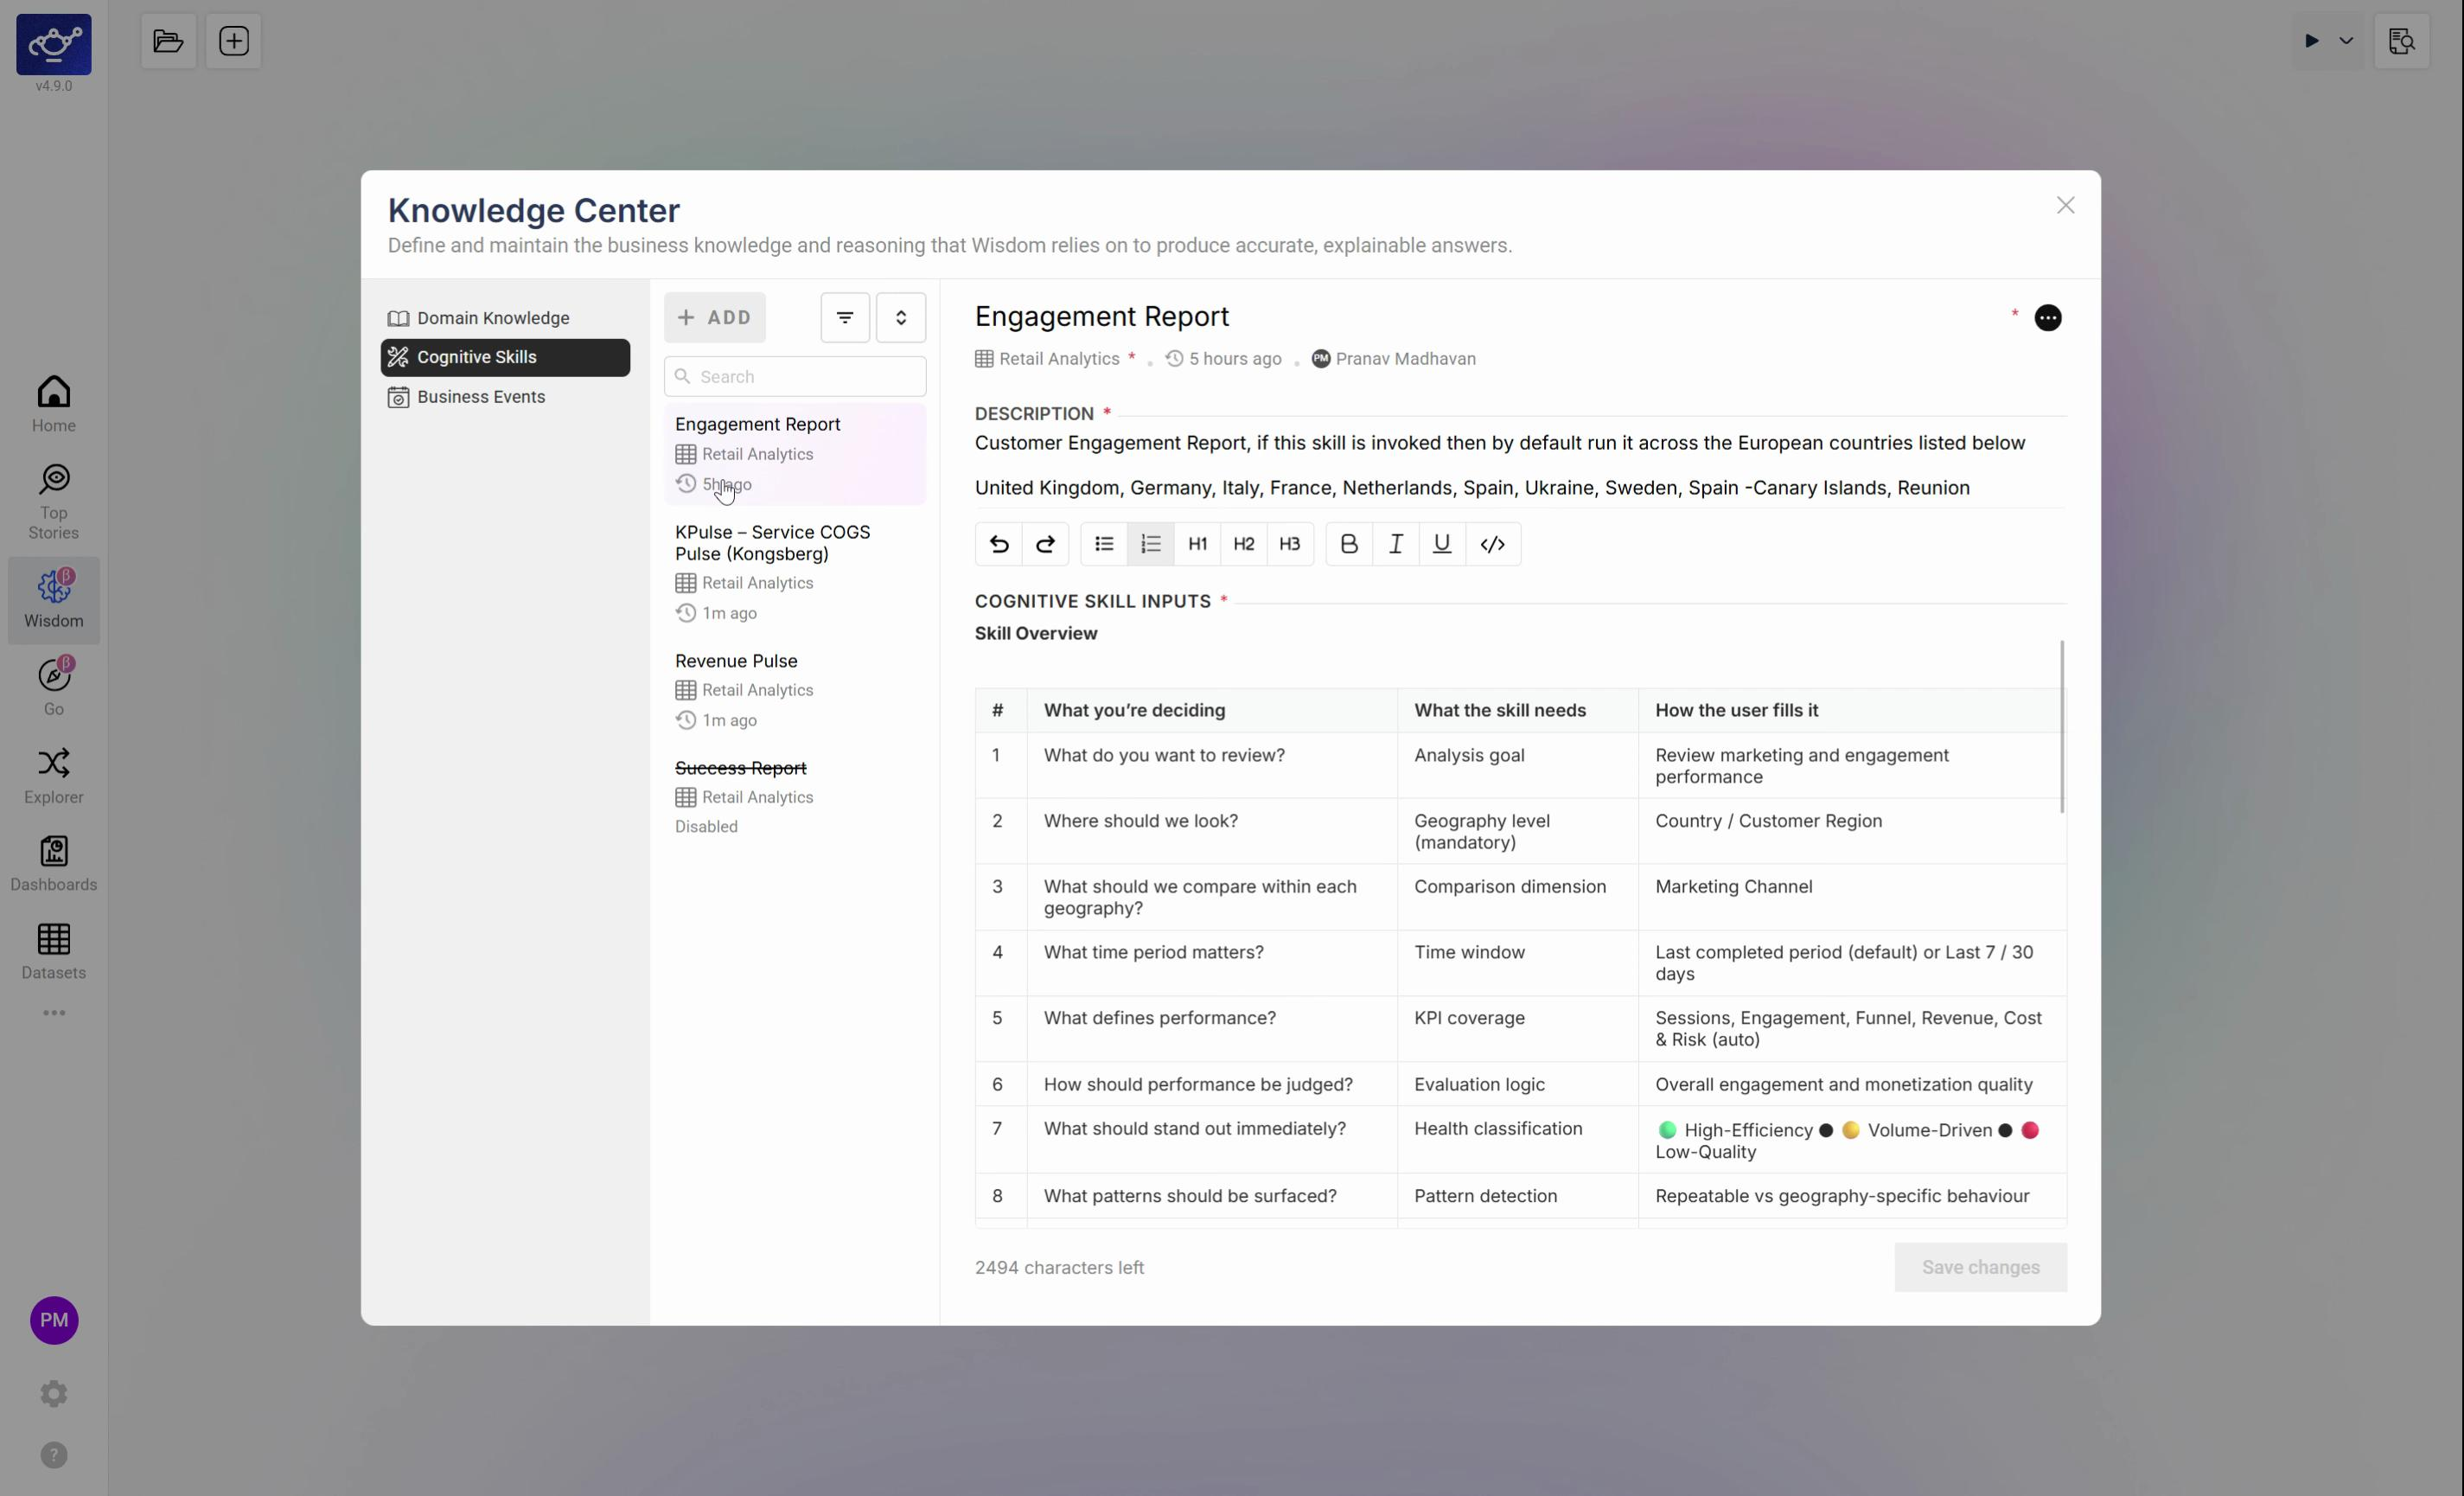
Built-in skills
Forecasting
Projects a KPI forward based on historical trend and seasonality. Invoke by asking “What will Revenue look like next month?”
Change Analysis
Explains why a KPI changed by pulling contributor rankings and attribution data. Invoke by asking “Why did Add to Bag Count drop last week?”
Segment Comparison
Compares the same KPI across two or more dimension values. Invoke by asking “Compare Revenue in UK vs US for last 30 days.”
Anomaly Explanation
Identifies the anomaly, explains the deviation from baseline, and surfaces the dimension values most responsible.
Cognitive Skills use the same deterministic services that power Top Stories, Explorer, and Datasets — Metric Service, Insights Service, Contribution Analysis, Forecasting, Scenario Planning. No LLM invents numbers.
What’s next
Wisdom Overview
Back to the full Wisdom feature overview.
Domain Knowledge
Give Wisdom the business context it needs to apply skills accurately.
Explorer
For hands-on dimensional analysis outside of the Wisdom interface.
Responsible AI
Each Skill runs as a deterministic pipeline — no LLM-generated numbers.