The Blueprint is your dataset’s operational definition. Every downstream feature — Top Stories, Wisdom, Explorer, Dashboards — reads from this single source of truth.
How to review and finalize your Blueprint
Navigate sections via the sidebar
Click any sidebar element — such as Dataset Name or Business Context — to jump to that section of your Blueprint. The sidebar is an index of every configuration decision GO built from your inputs. Sections highlighted in green are already completed or confirmed.
Switch to the content management view
Switch to the content management view to see a side-by-side layout — your Blueprint document on the left, with analytics, progress bars, and configuration panels on the right. Scroll through the main panel to review each onboarding step as a structured checklist, with instructional guidance and emphasized learning points at each milestone.
Open the Onboarding Readiness panel
In the right panel, click the Onboarding Readiness collapsible header to expand it. The panel shows your Onboarding Checklist with green progress indicators — each item represents a configuration decision GO made with you, with its completion status clearly visible.
Expand Next Instructions
Click Next Instructions to expand the section. It contains detailed configuration guidance and reference material — useful if you need to revisit a decision, understand why GO made a specific recommendation, or hand off the Blueprint to another team member.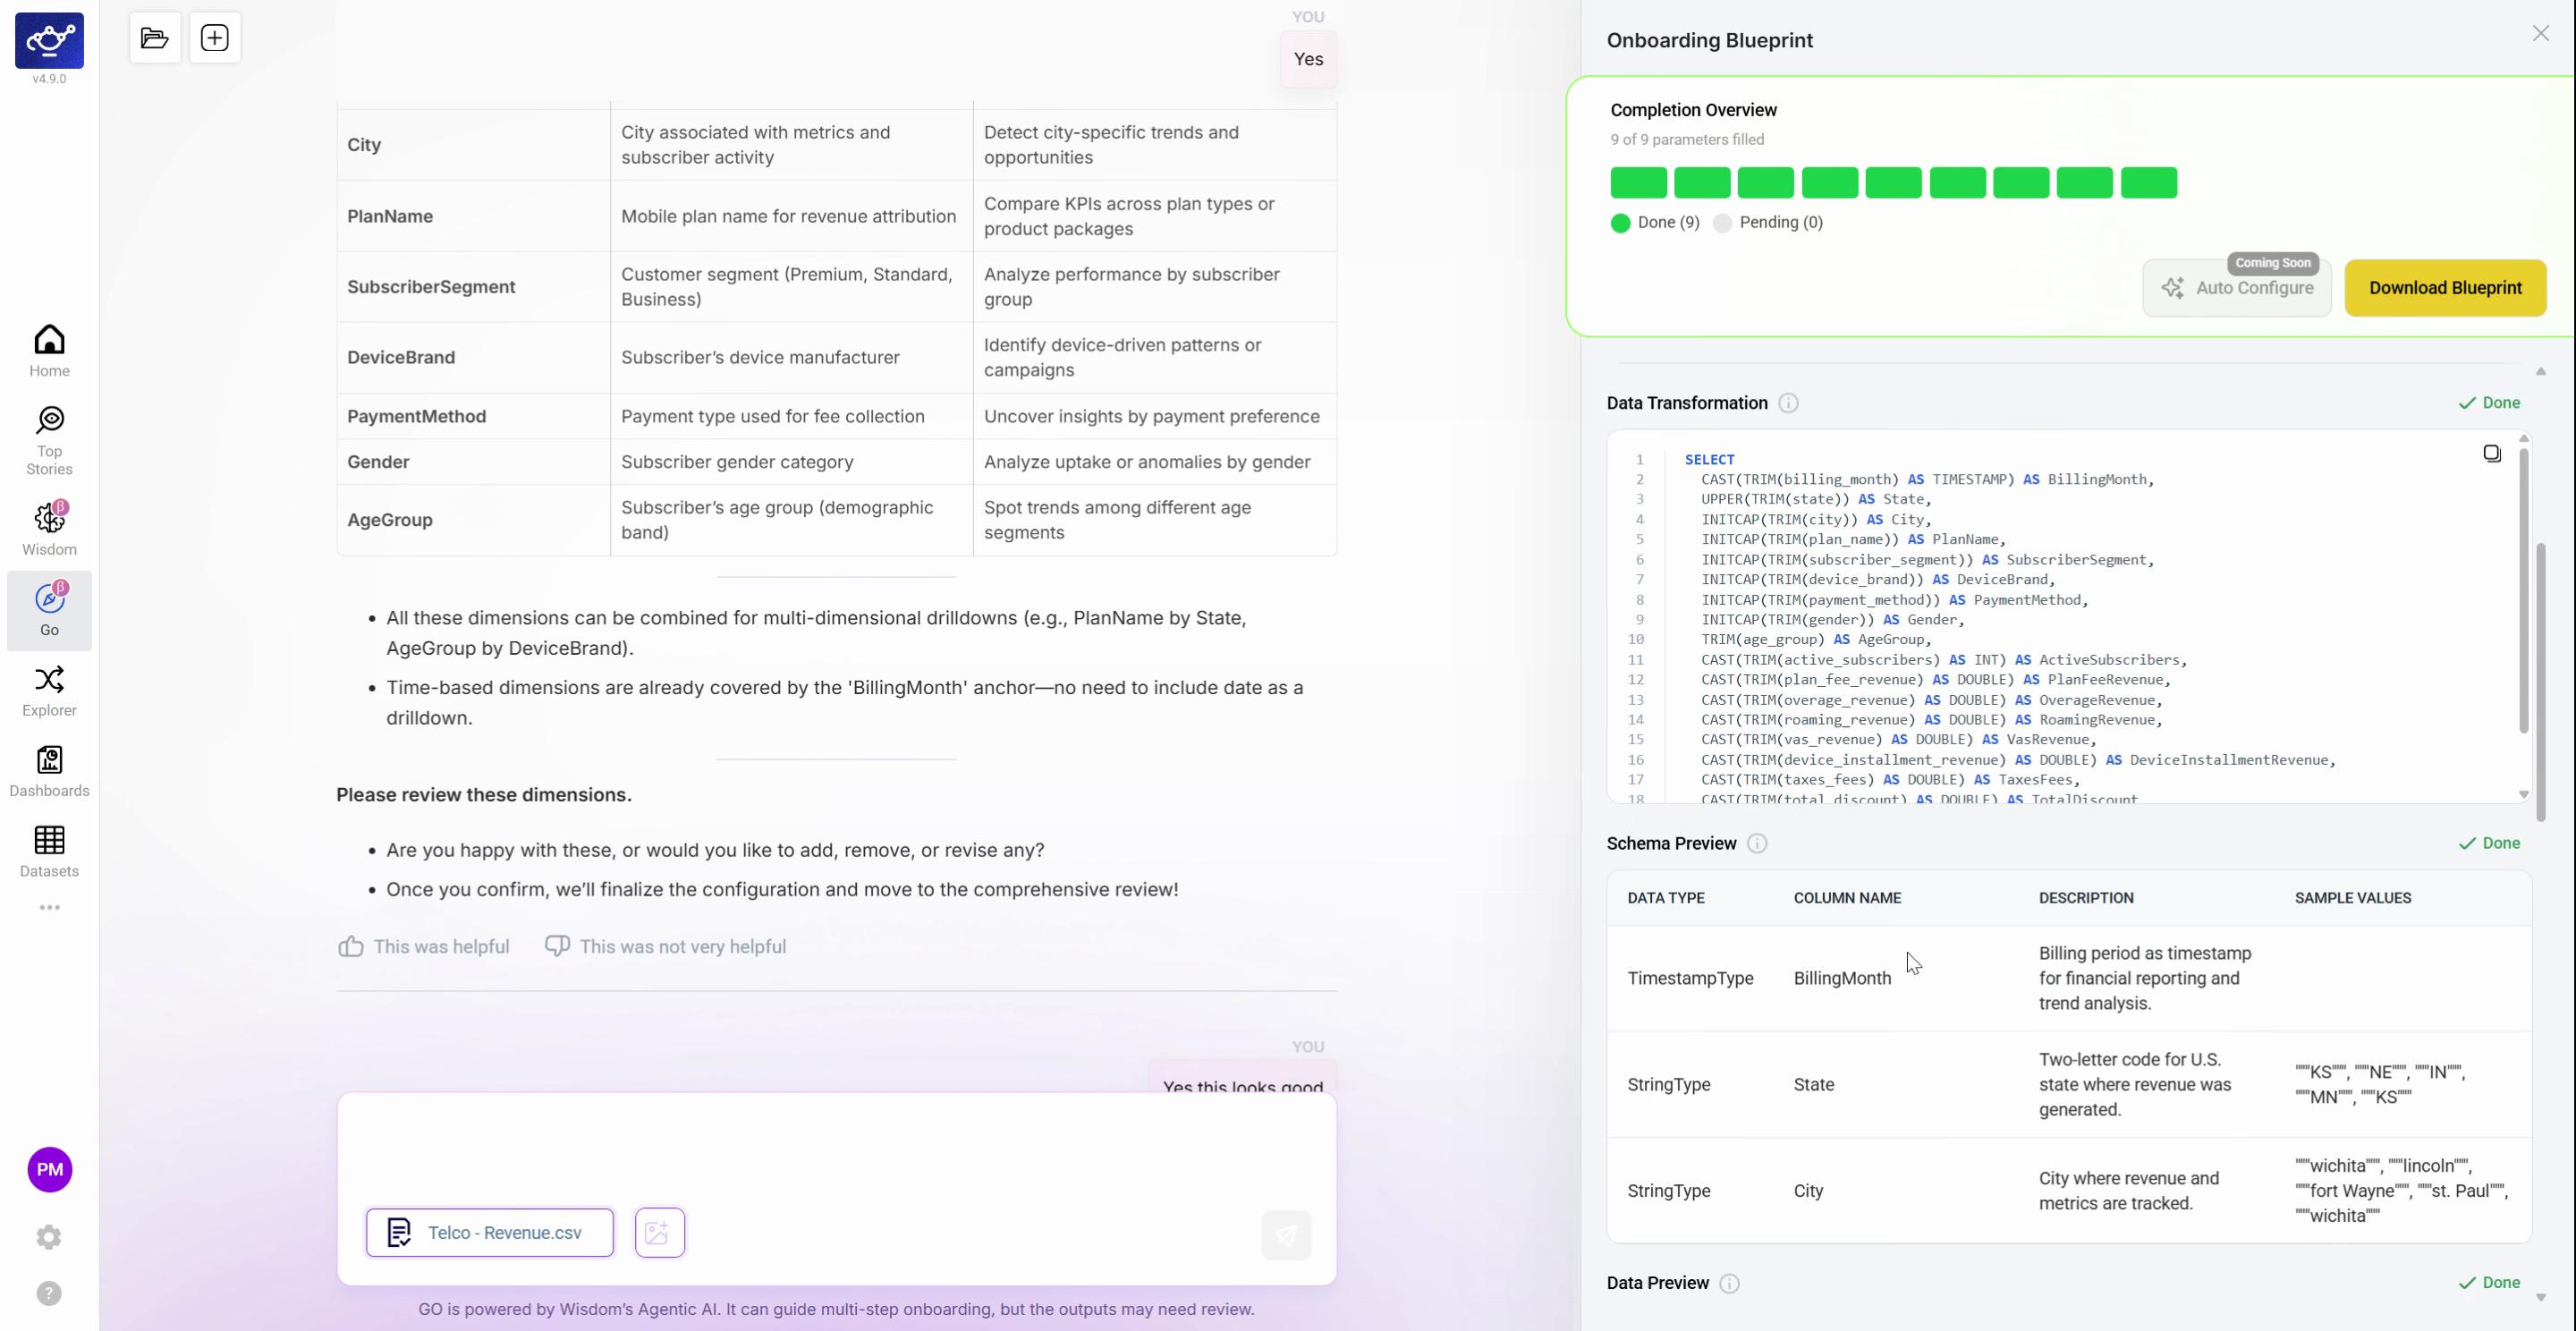
What the Blueprint contains
Data Transformation
Spark queries and bucketed dimensions that shape your raw data into an analytics-ready format.
KPI Definitions
SQL-validated metric expressions mapped to your business language.
Dimension Assignments
The slicing attributes GO recommends for uncovering the why behind your numbers.
Time Anchor
The column that anchors all time-series analysis and period comparisons.
Granularity
The resolution at which DataGenie generates stories — daily, weekly, or monthly.
Mock Anomaly Preview
Even before your data is live, GO generates mock anomaly previews showing how DataGenie will flag deviations for your KPIs and dimensions.
What’s next
Top Stories
Start reviewing the most impactful metric changes surfaced after onboarding.
Datasets
Fine-tune your KPI configuration, dimensions, and anomaly detection after GO completes.
Anomaly Detection
Configure the detection models that power your stories.