What GO needs
Sample dataset (required)
A representative sample (~100 rows matching final schema). GO maps fields, sample values, and intended descriptions.
Dashboard context (optional)
Screenshots from Tableau, Power BI, Excel — GO uses these to suggest KPIs and dimensions that match how your business already tracks performance.
How to use GO
Upload your sample dataset
Click Upload Sample and select a representative file from your dataset — around 100 rows is enough. GO uses this file to learn your data structure: field names, sample values, and the shape of your data. Everything GO suggests about KPIs, dimensions, and transformations is grounded in what it finds here.
Review GO's field mapping and auto-generated descriptions
Once the file is uploaded, GO scans every column and automatically suggests field descriptions based on what it detects. You’ll see each field listed with its sample values and a proposed description — this is GO’s first pass at understanding your data’s vocabulary. Review these to make sure GO has the right baseline before it starts recommending metrics.
Clarify column details and answer follow-up questions
GO pauses to ask clarifying questions about specific fields — for example, confirming the currency for a revenue column or the unit for a numeric field. Type your answers directly in the chat. These clarifications feed directly into GO’s KPI and dimension suggestions, so accurate answers here mean more relevant recommendations downstream.
Confirm your data setup before continuing
Before moving to the next phase, GO presents a summary of everything it has learned so far and asks for your confirmation. Review the proposed field mappings and column details, then click Confirm to proceed. Nothing advances without your explicit approval — GO never moves forward automatically.
Upload dashboard snapshots for KPI and dimension suggestions
Upload screenshots of your existing dashboards — from Tableau, Power BI, Excel, or anywhere your team currently tracks performance. GO reads these visuals to suggest KPIs and dimensions that align with how your business already measures success. This step is optional but significantly improves the relevance of GO’s recommendations.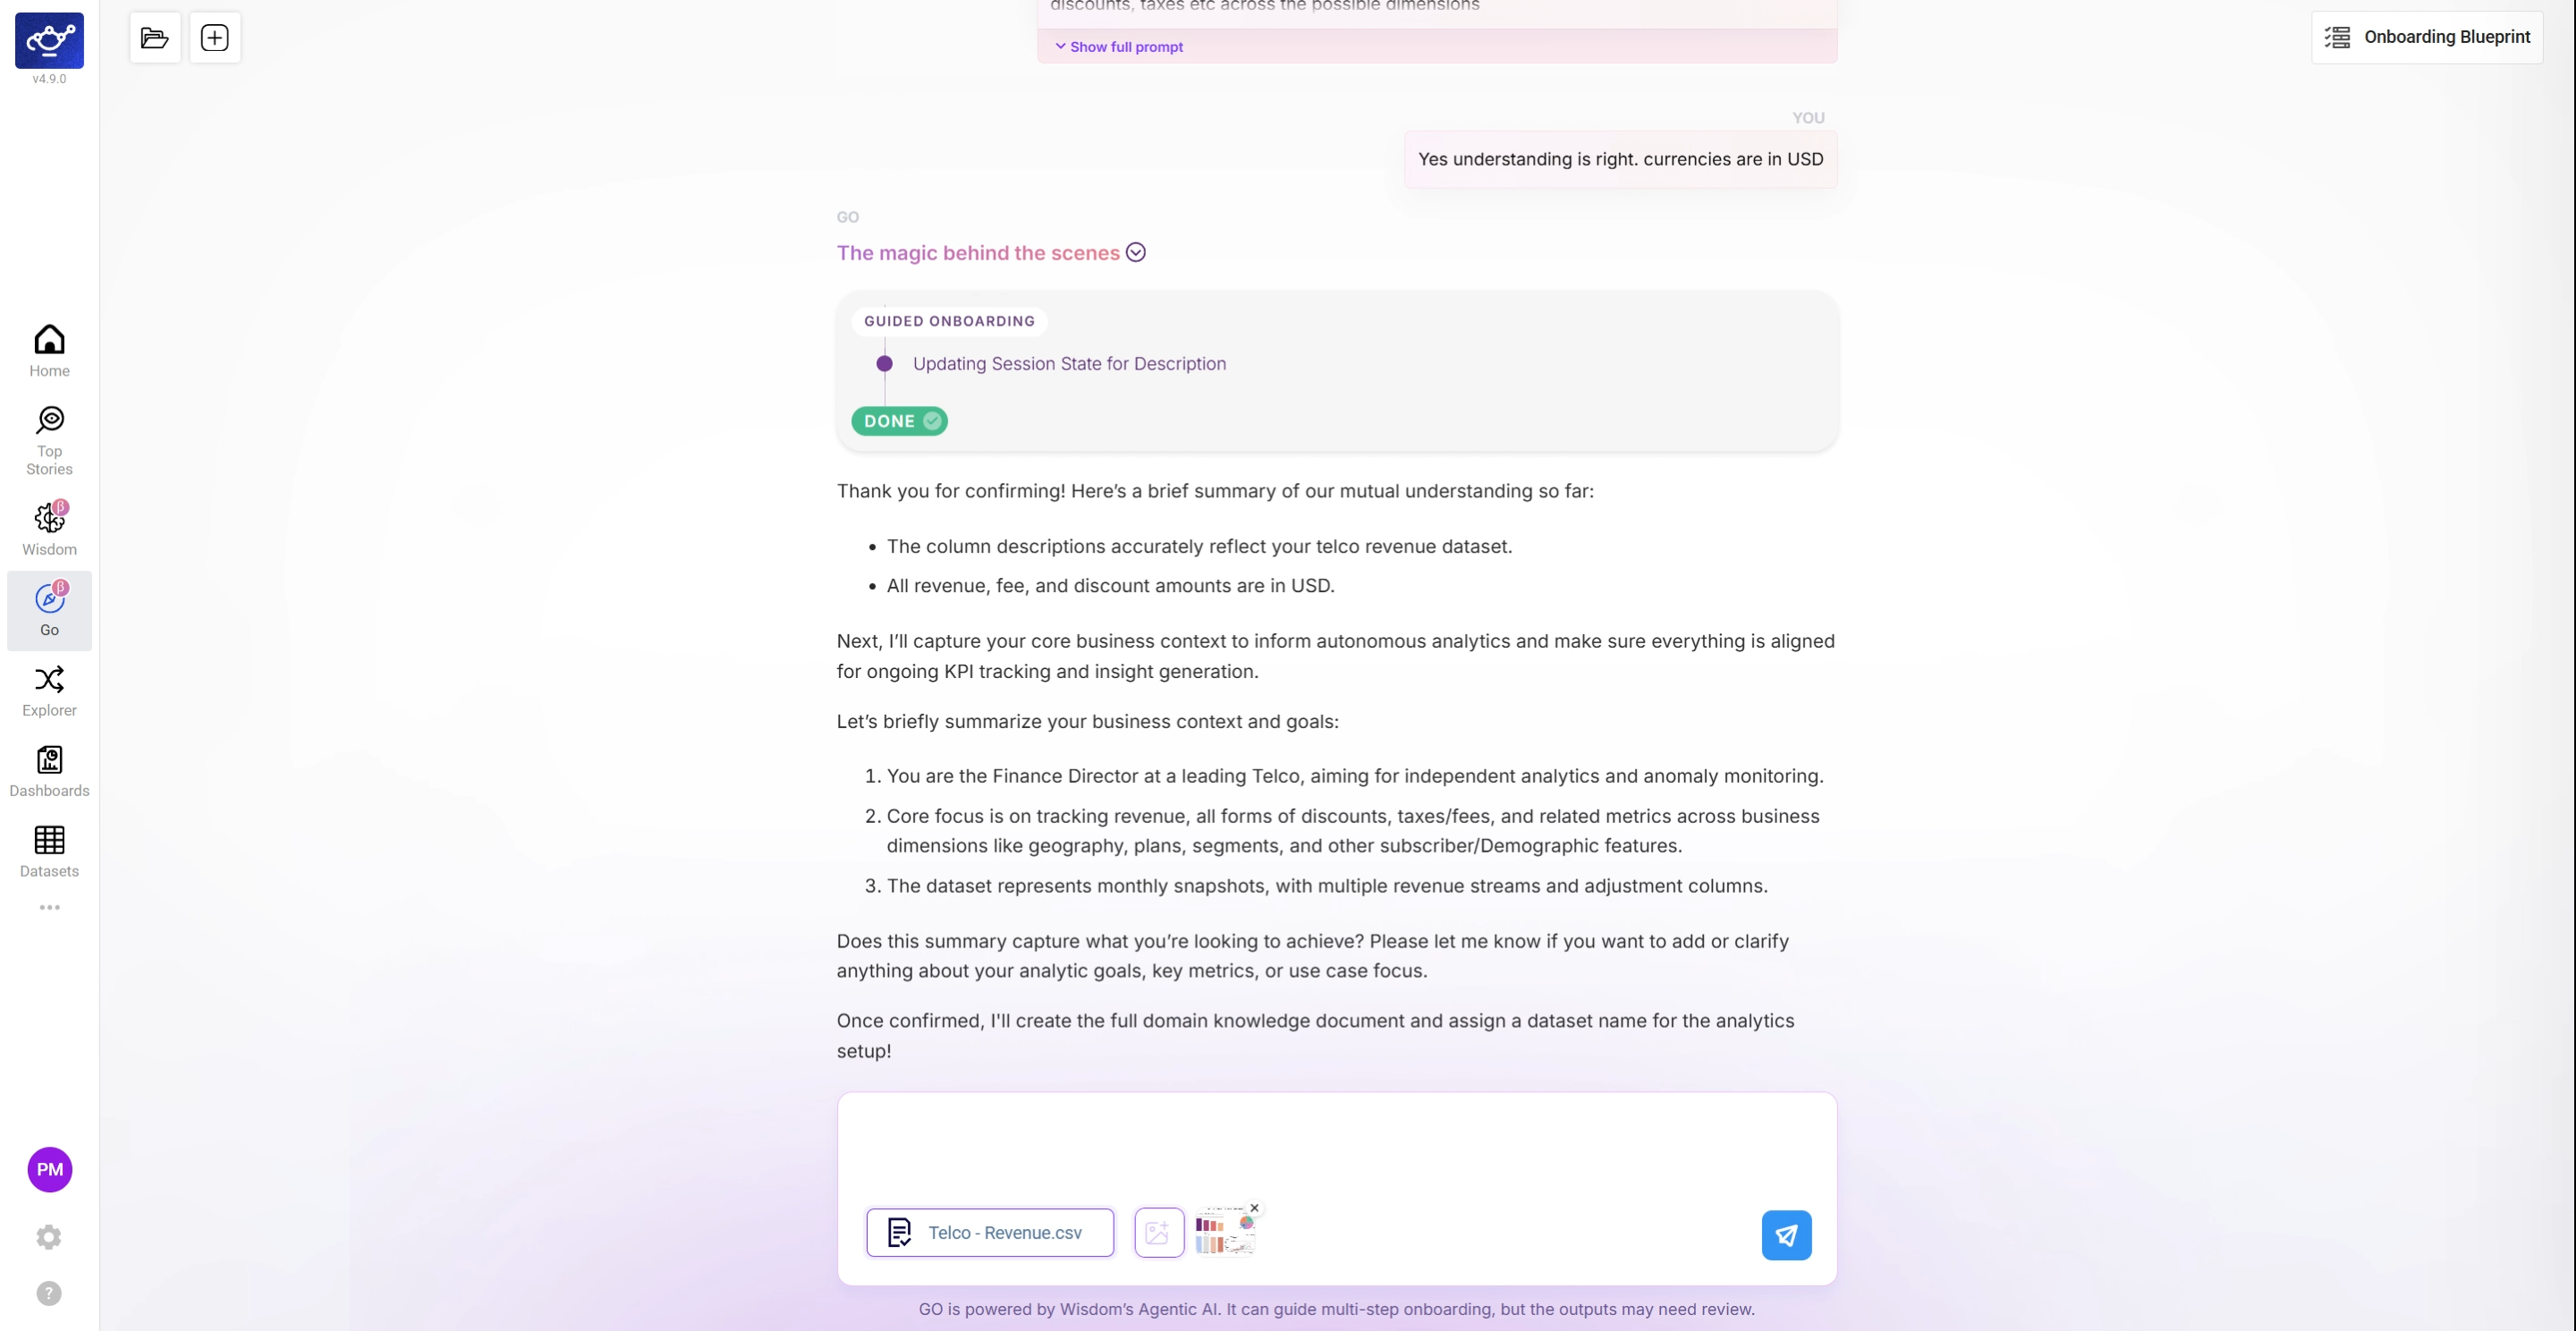
Review GO's summary and confirm to activate monitoring
GO presents its complete summary — KPIs, dimensions, time settings, and data transformations — and waits for your final confirmation before activating DataGenie’s analytics features. Review each section carefully, then confirm to proceed. Once confirmed, DataGenie immediately begins tracking your metrics across hundreds of thousands of combinations.
Start simple. Provide one representative sample and the primary KPIs your team cares about. You can expand and refine after the first successful onboarding.
What’s next
Complete workflow
Deep-dive into every GO step — data transformation through Blueprint finalization.
Import / Export
Reuse Blueprints across workspaces and datasets.
Top Stories
See what autonomous monitoring surfaces after onboarding.
Datasets
Fine-tune KPIs, dimensions, and detection post-onboarding.
Autonomous Insights
The detection model GO unlocks.
Core concepts
Refresh on KPIs, dimensions, contributors.