How to read a Brief
Open a Brief
Click any Brief card in your feed to open it. You’ll see a concise summary of key metrics and patterns at the top.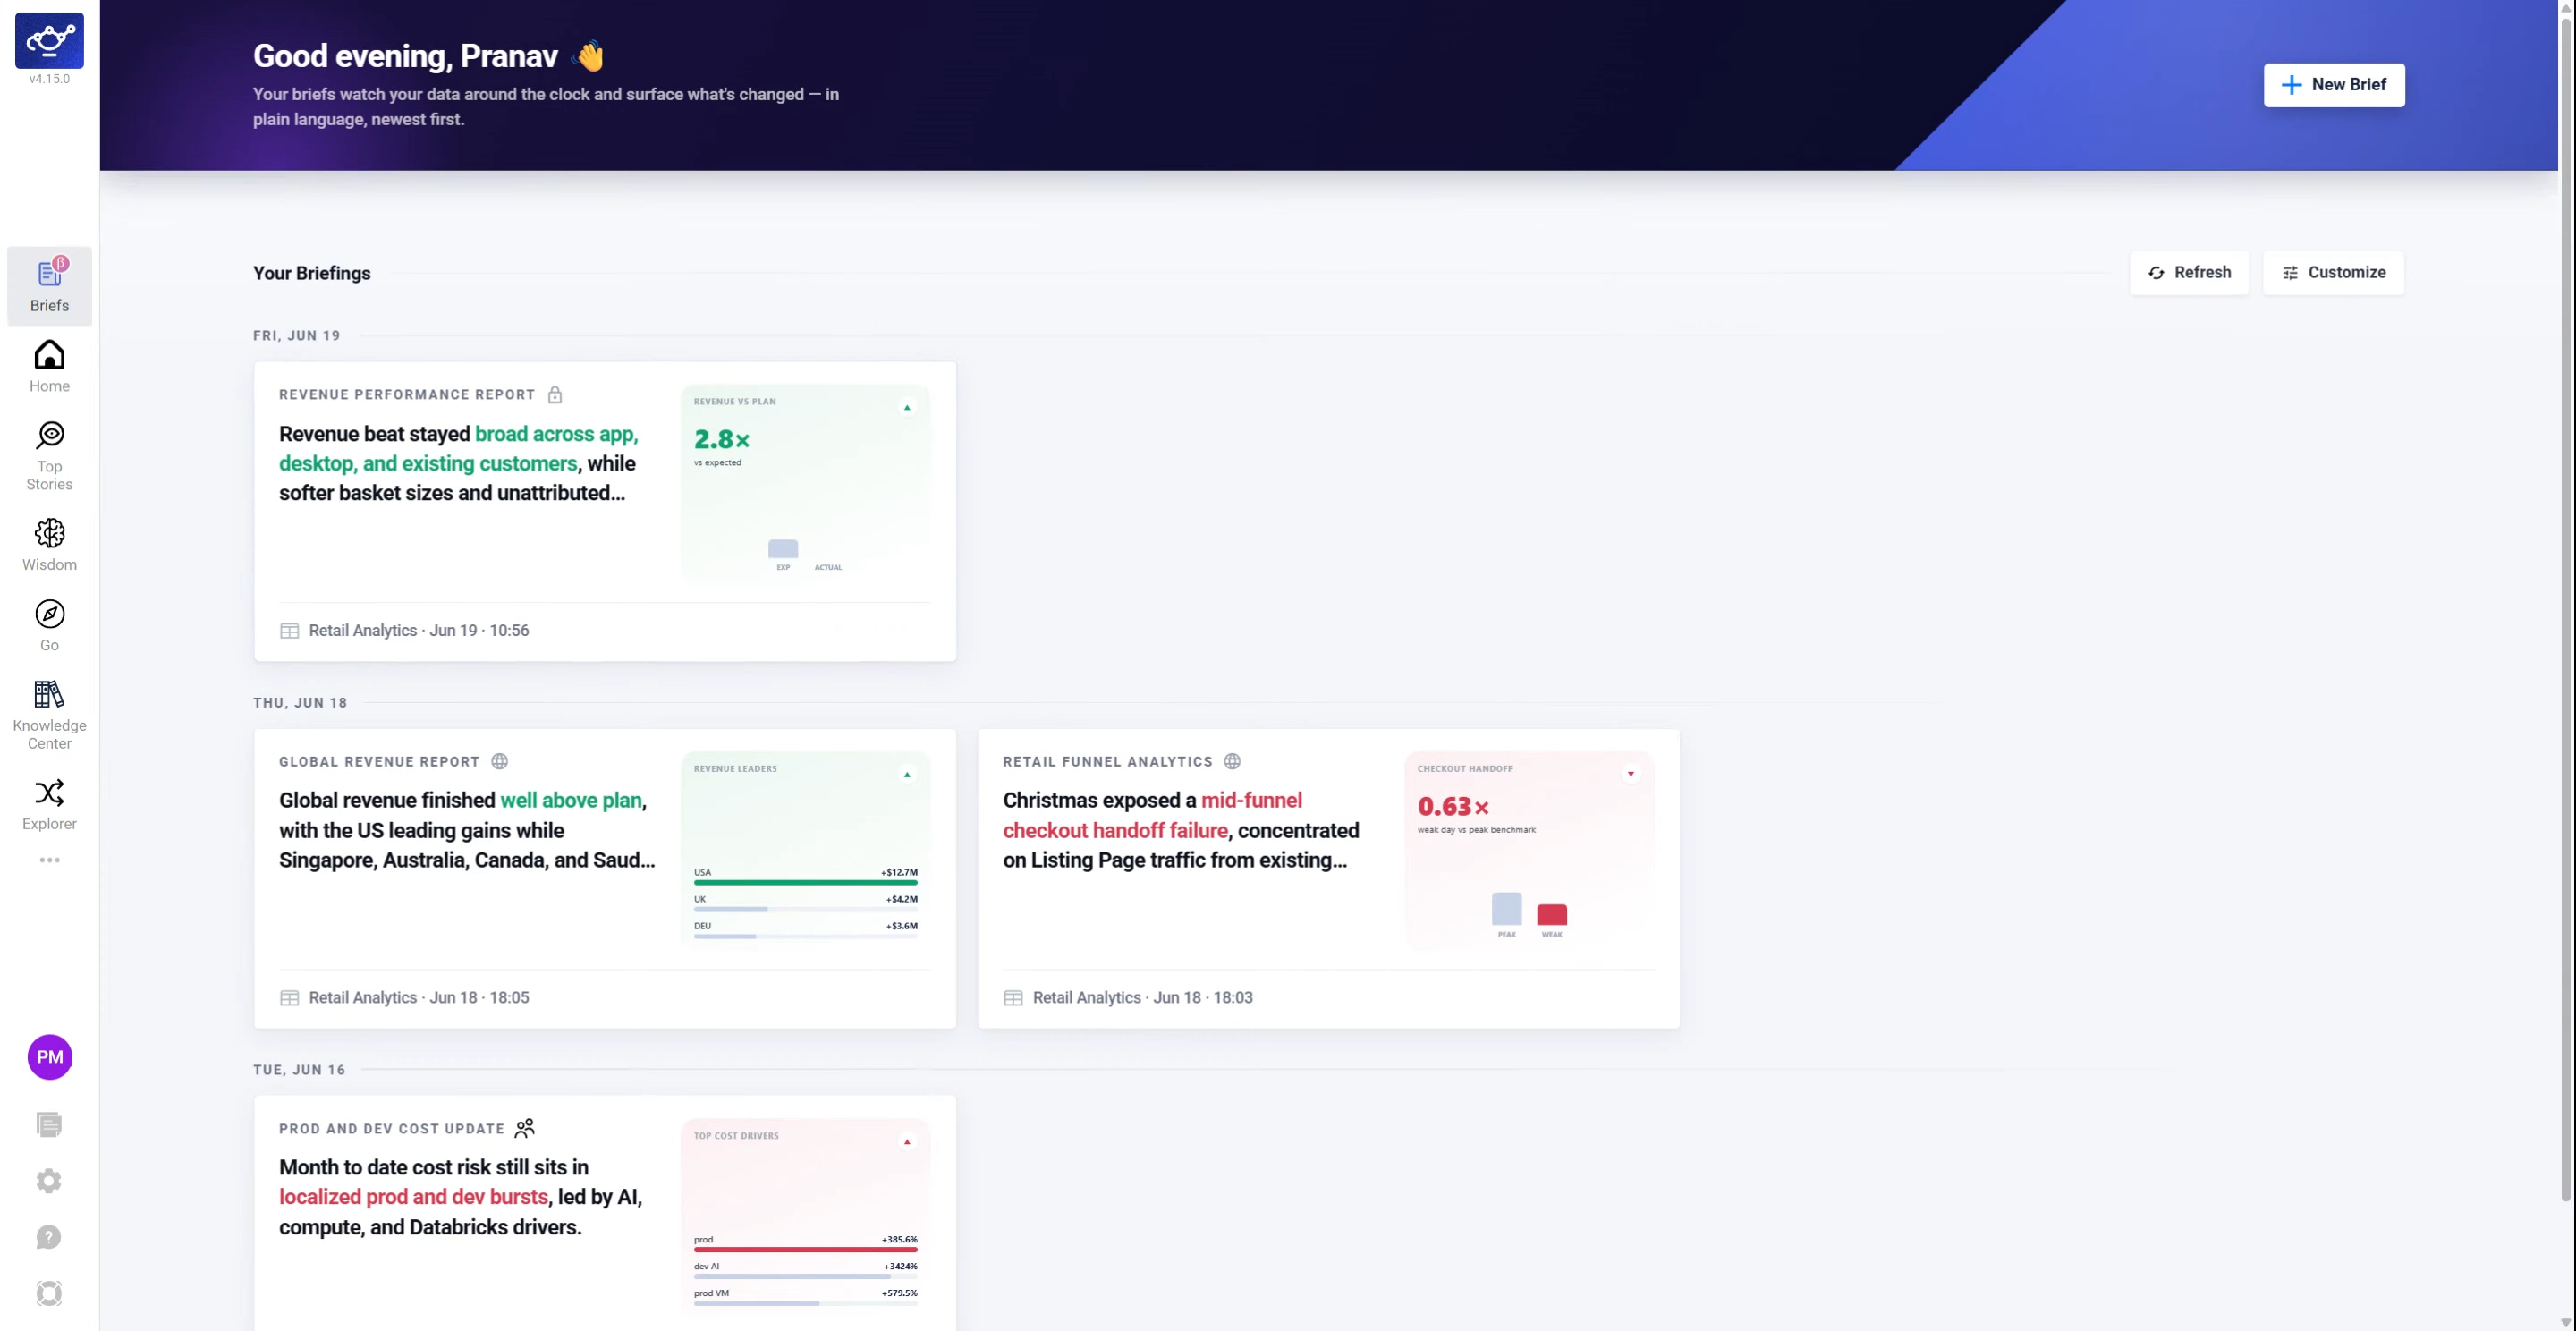
Review the hero metric and anomaly map
The top of the Brief shows the hero metric, anomaly map, key insights, and largest deviations — the full picture before you scroll.
Scroll to supporting insights
Scroll below the anomaly map to find supporting insights with additional context, trends, and deviations.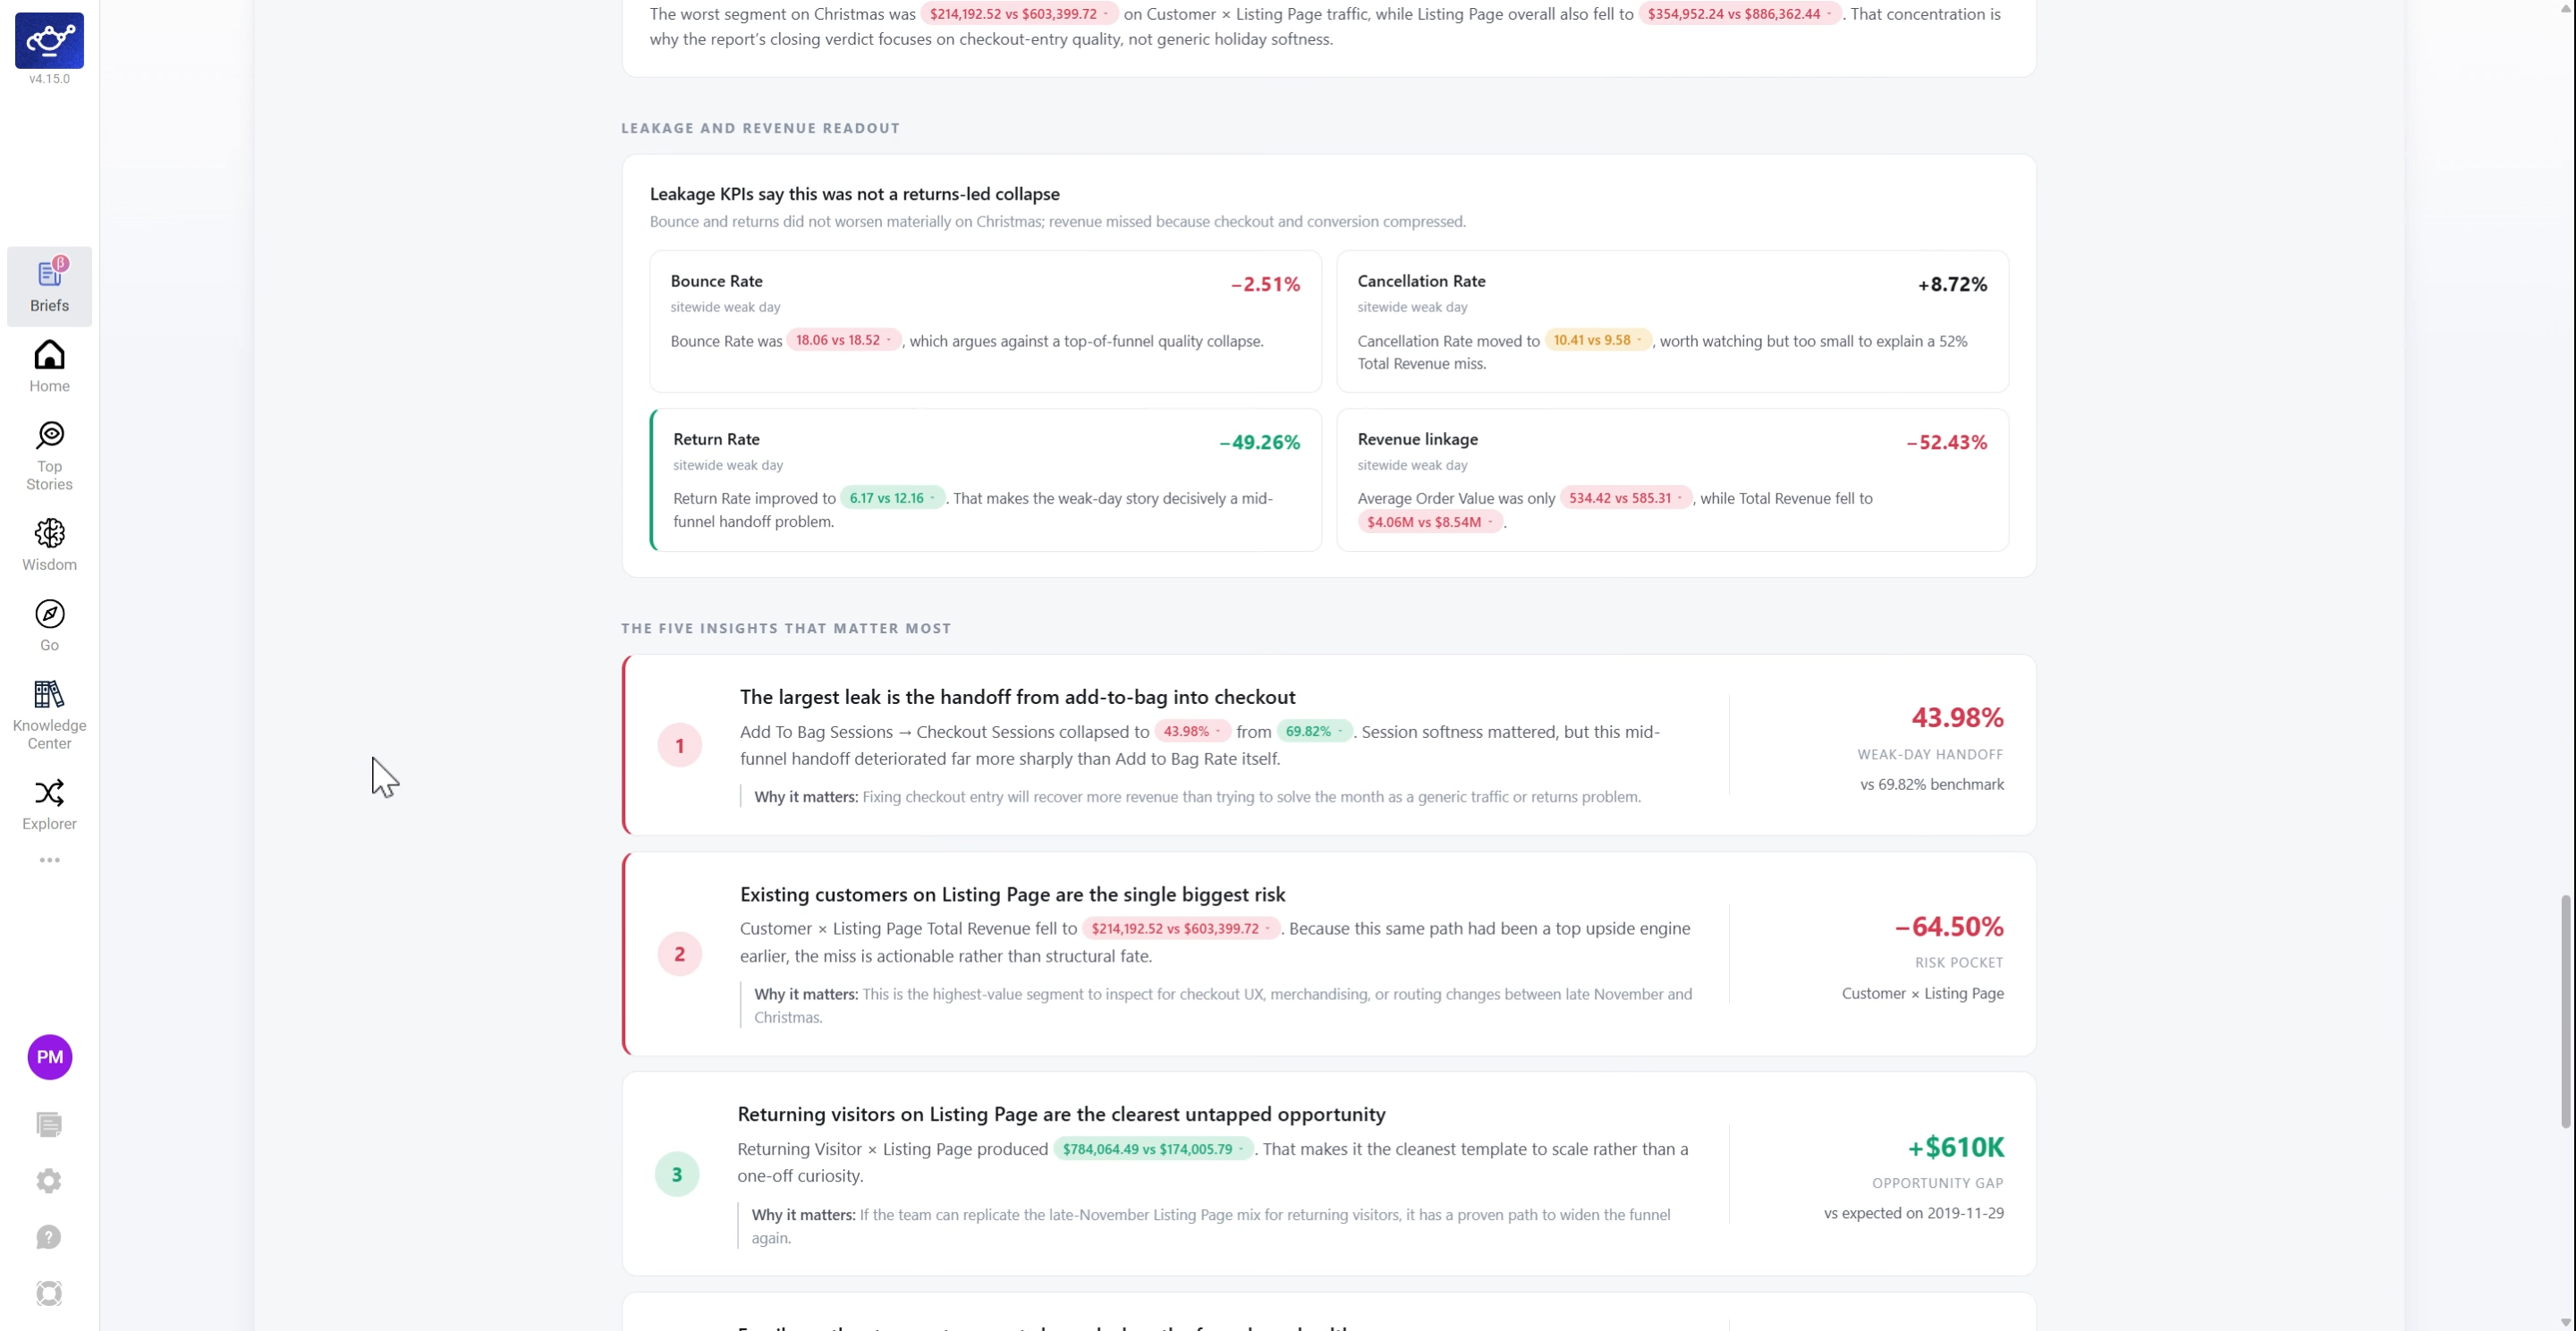
Hover a value to see its source
Hover any number to see a tooltip showing the grounded source behind it — DataGenie writes the narrative, your data supplies the numbers.
Click a citation to jump to the source story
Click any citation link to navigate directly to the Top Story behind that insight. The narrative and the underlying data are always one click apart.
What’s next
Top Stories
The source of every story and anomaly cited inside a Brief.
Wisdom
Follow up on any Brief insight with a multi-stage Wisdom analysis.
Sharing & Permissions
Share a Brief with the right people at the right access level.