How to use Top Stories
Review the Top Stories feed
Open Top Stories from the left sidebar to see key metrics and anomalies ranked by business impact.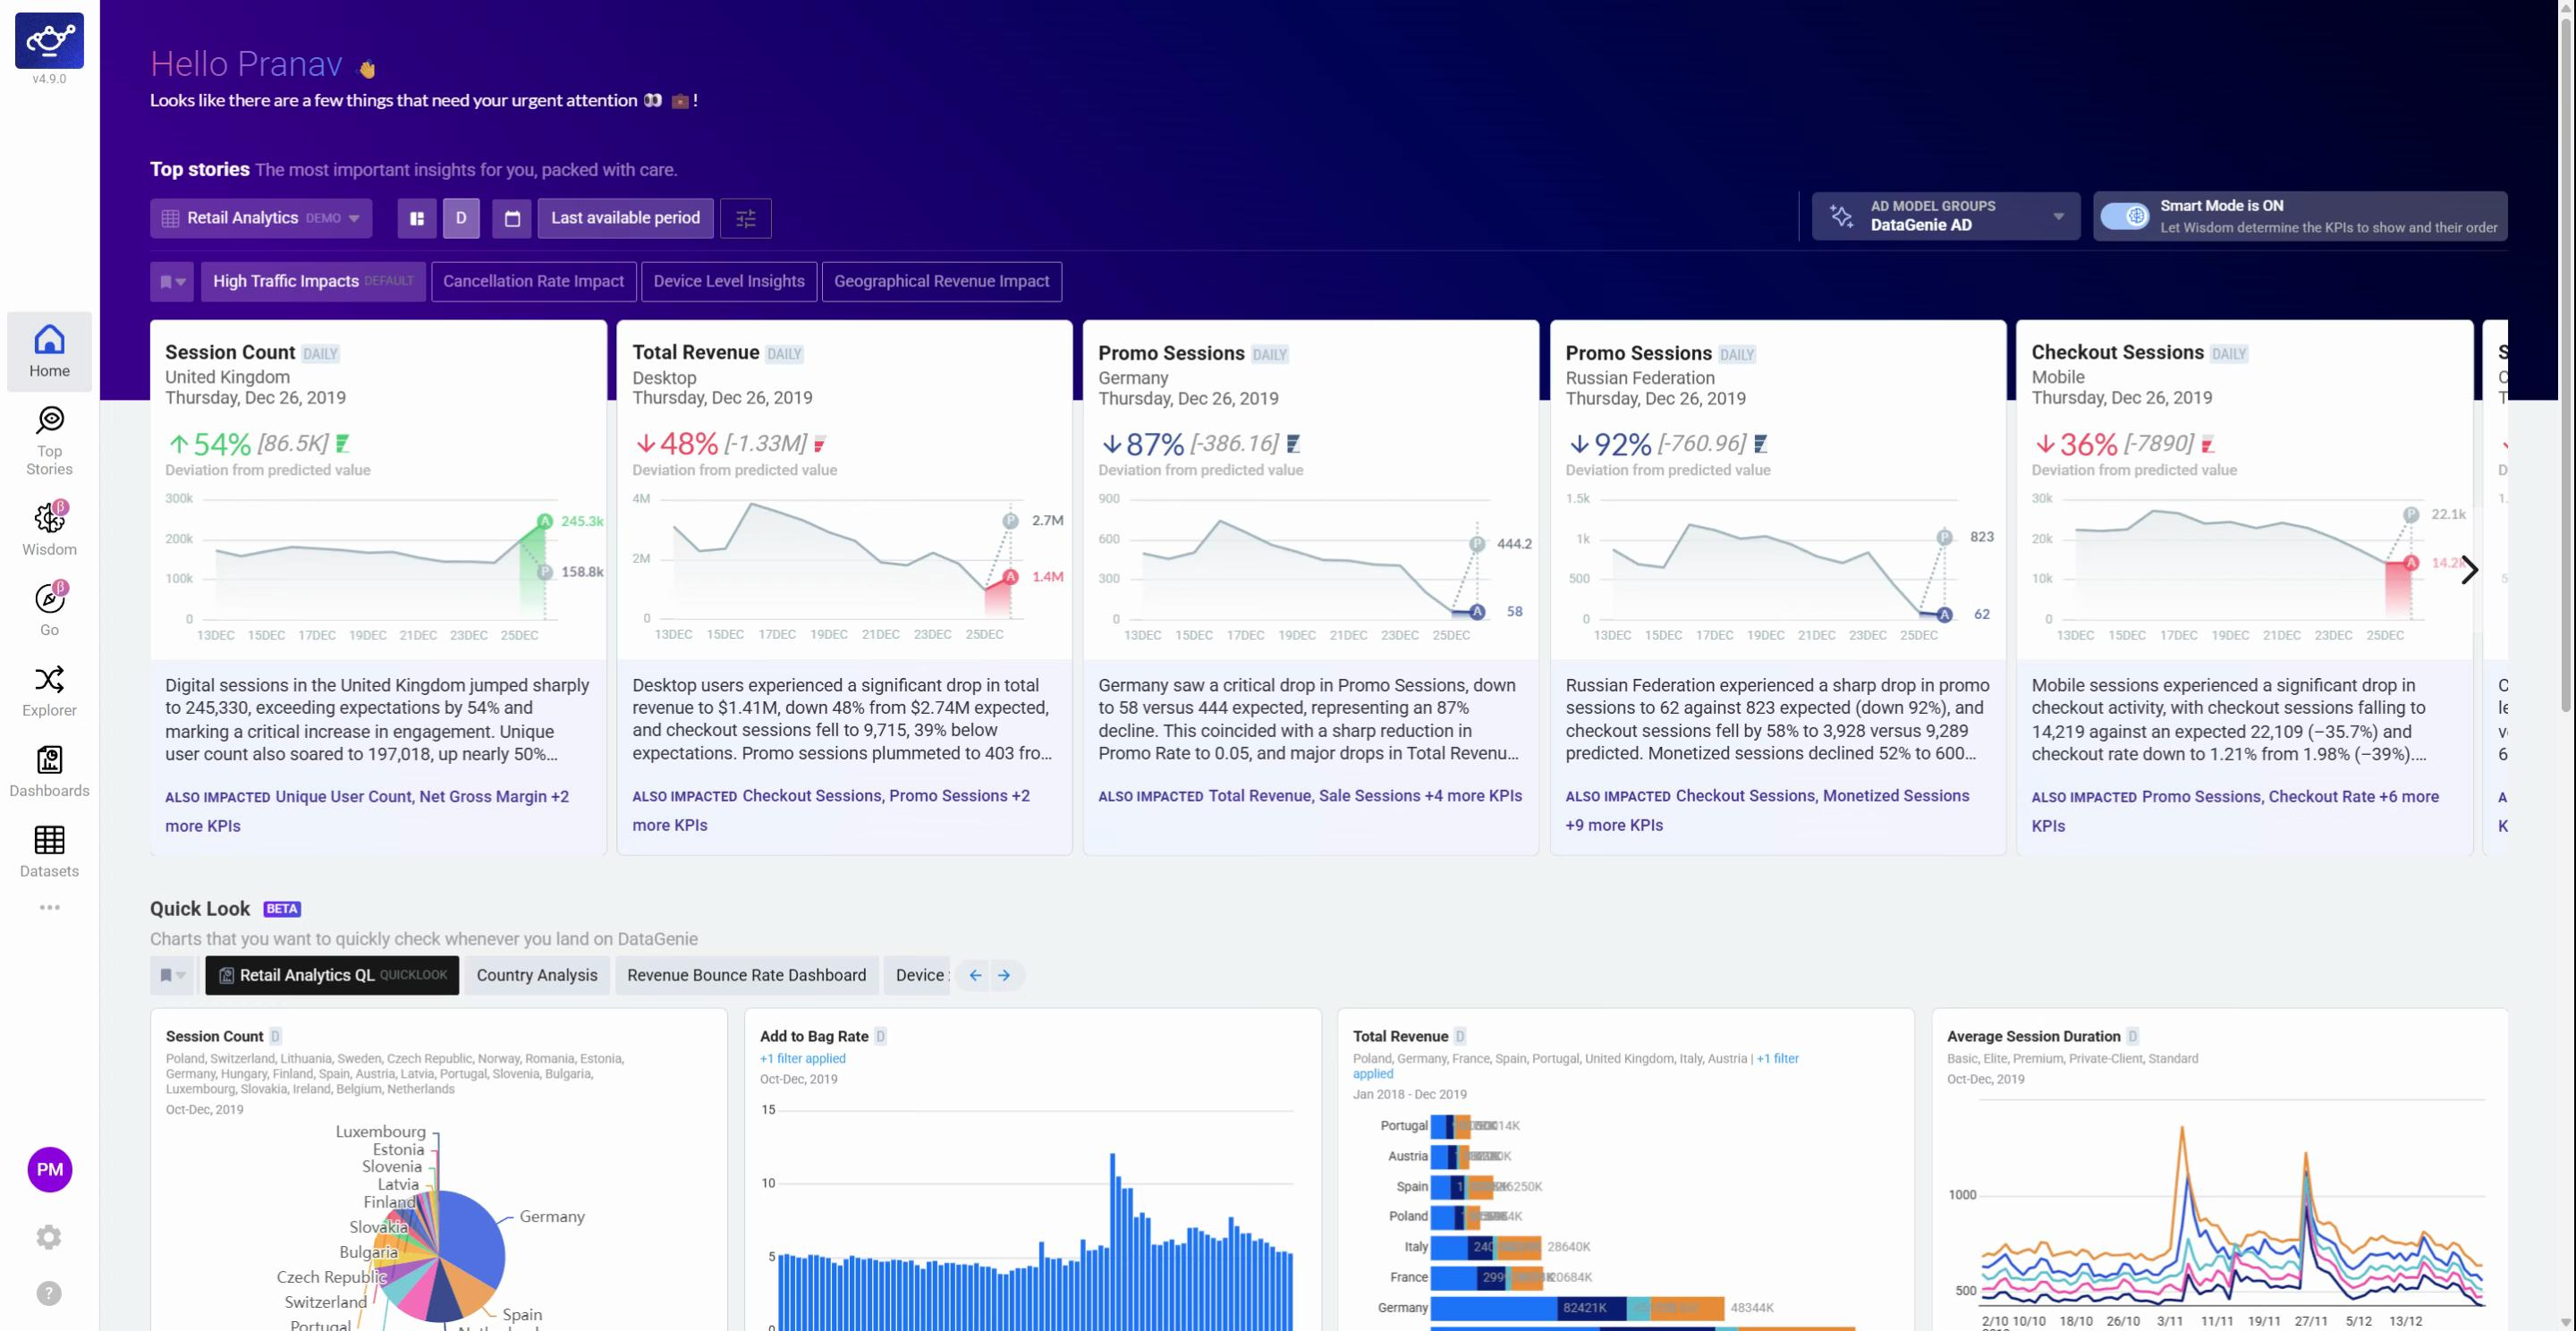
Drill into a story for deeper detail
Click any story card to open its full report — When, Where, What, What Else, and Why.
What’s next
KPI Attribution
Tree view of Contributors, Opposers, and Side Effects behind any story.
Alerts configuration
Stay informed on autonomous insights without checking in manually.
Filter Presets
Control which stories get generated — scope autonomous detection to your team’s focus.
Trend analysis
Multi-period overlays for deeper historical context.
Wisdom
Validate or follow up on any story in plain English.
Autonomous Insights
Understand the detection engine behind Top Stories.